Member-only story
The Beauty of the Logistics Map (Equation) with Python Code and Golang

If you look closely you’ll see chaos.

Such a simple equation,
r is the reproduction rate, in this particular usage the Map blows up at r>4.
A word, the term “Map” means mapping a value of x(n) to another value of x(n+1), we could use the term function. Historically this equation is called the Logistics Map.
In the early days of computing the Logistic Map was used to create random numbers. The Logistic Map its self has roots in the Logistic Equation which is used to map various growth curves, population, tumors and Covid-19 and other epidemics. You might be interested in my articles on modeling Covid-19 and other epidemics.
If we set r to a fixed value such as 1.5 and iterate over 25 cycles of n we get the standard population model, i.e. rabbits.

If you want to play along, its a simple python program.

Pretty standard fare. When we increase r to say r=2.5 we start to see over shooting before stabilization.

The instability increases as r increases. r=3.8
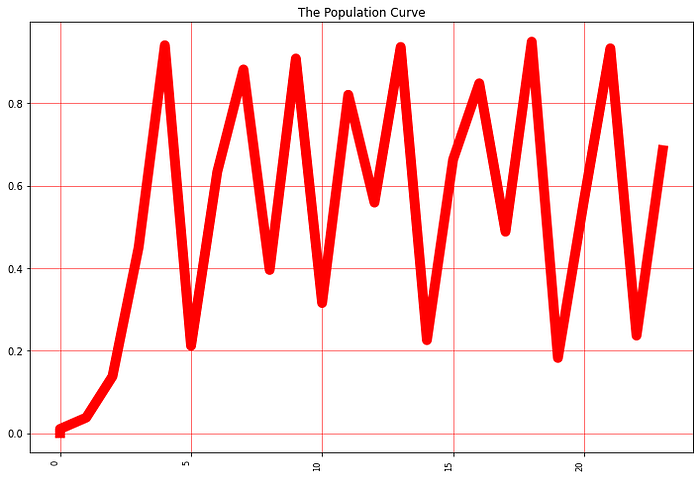
And at r=4.0 we see more instability in population.
